In ToolSense, every Asset (equipment, machine, tool, etc.) fitted with an IoT sensor continuously gathers usage data.
Based on an Asset’s runtime, the percentage for “Total Usage” is calculated.
 What is Total Utilization?
Total Utilization shows the usage percentage of an asset since it’s been in ToolSense AND outfitted with an IoT sensor.
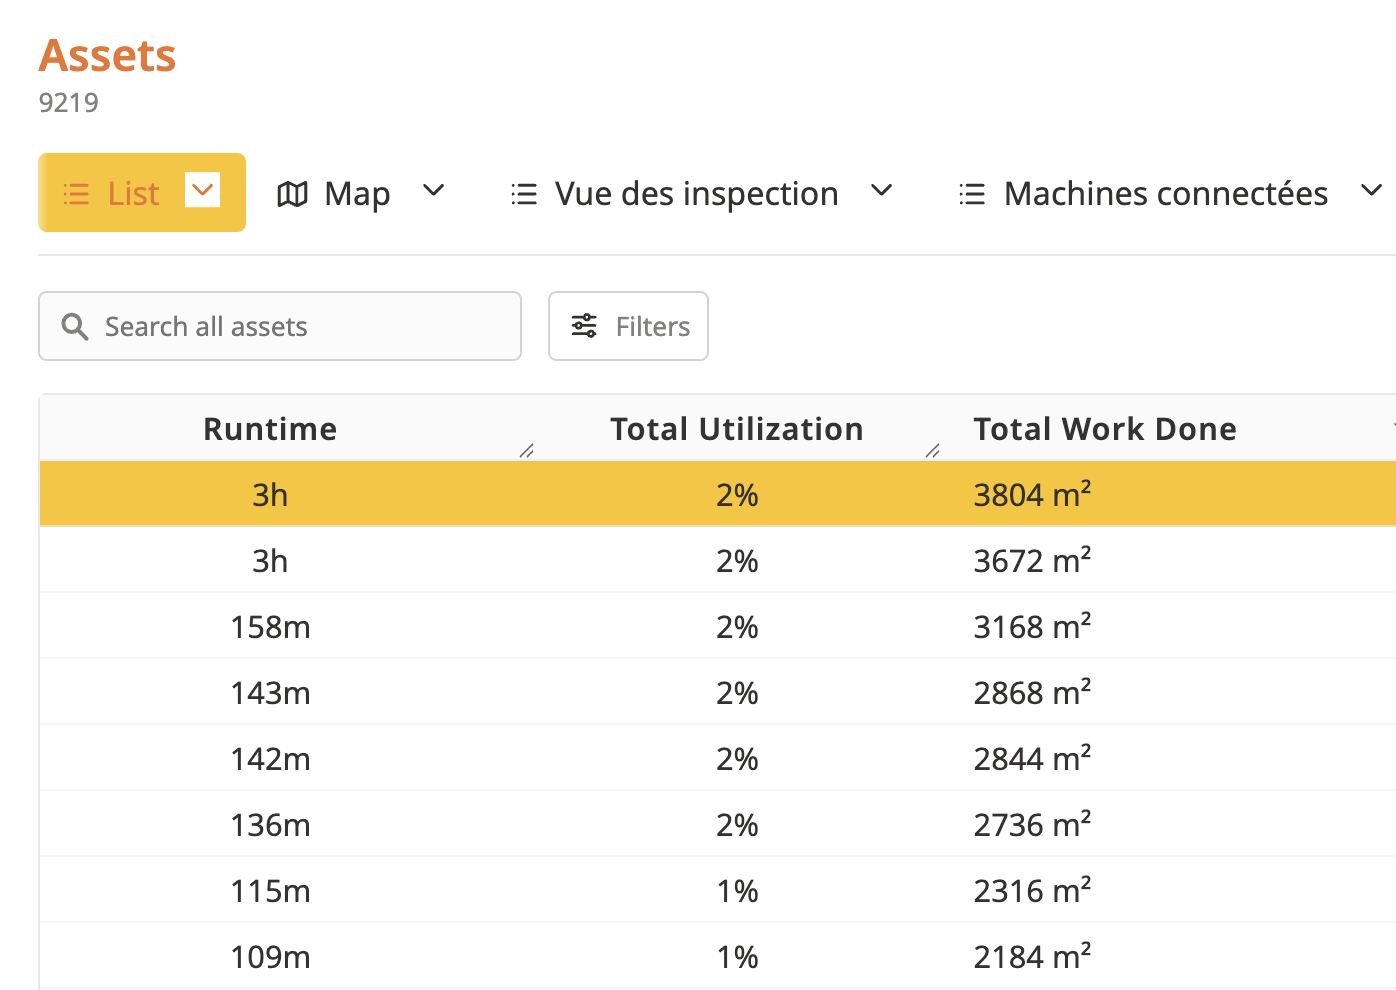
Basically, it’s a raw way to measure how long the machine’s been used compared to the total time since it was added to the system.
Example:
If an Asset has a usage time of 10 hours since it was created in ToolSense, 4 days ago, its total usage will be 10 hours of use / (24 hours X 4 days = 96 hours in total) = 10.4% total usage.
 Raw data to interpret carefully
Total usage is a raw data point that doesn't take into account the difference between equipment types.
Actually, every machine model has a specific optimal usage time — some are made to run for several hours a day, others just 1 hour a day.
 For a clearer view: the "Usage" dashboard
To get around this limit, it's recommended to use the “Usage” dashboard in ToolSense.
This tool lets you add a key parameter to your analysis:
The optimal daily usage time (depending on the asset type)
The dashboard compares real usage to optimal usage.
It gives you a clear, contextual and actionable view of how much your machines are used.
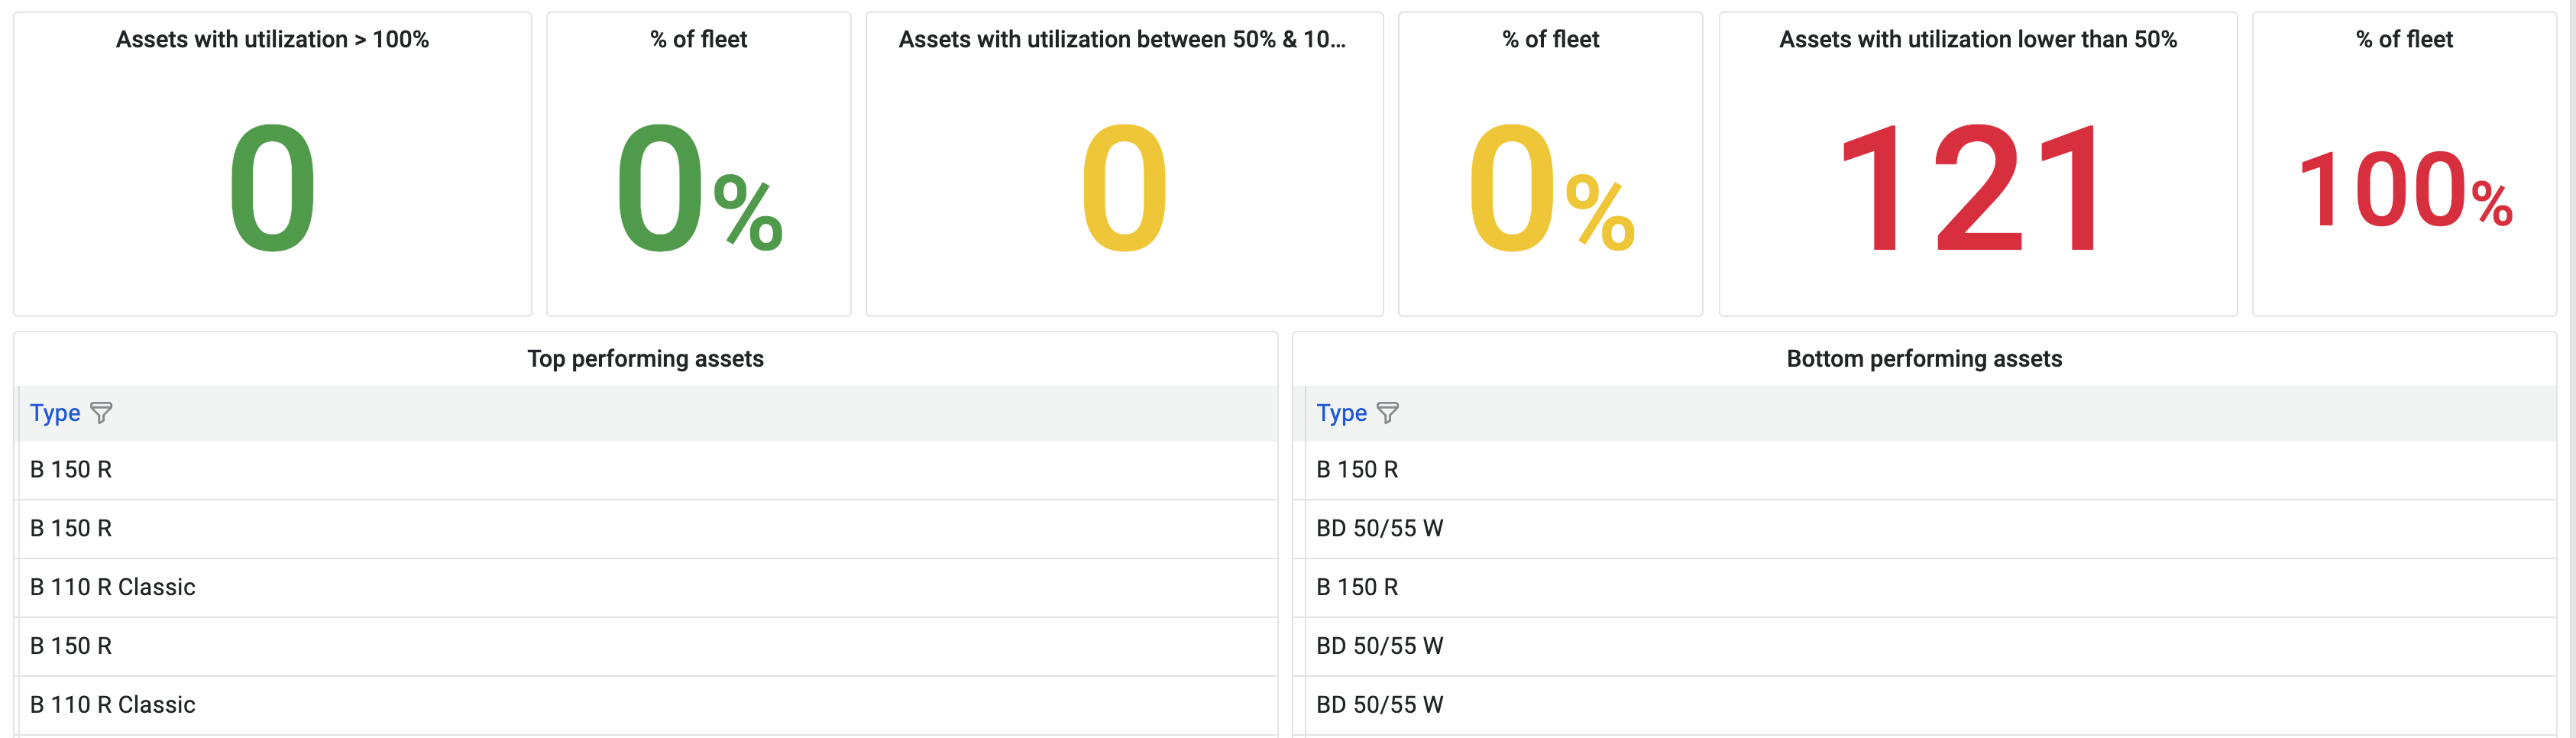
Understanding the 3 zones =
Green zone = Assets that are used more than 100%
Since these assets have been in ToolSense, their total usage hours are higher than the hours they were originally acquired for.
Yellow zone = Assets that are used between 50% and 100%
Since these assets have been in ToolSense, their total usage hours are lower than the hours they were originally acquired for.
Red zone = Assets that are used less than 50%
Since these assets have been in ToolSense, their total usage hours are less than half the hours they were originally acquired for.
Example =
An Asset was added in ToolSense 4 days ago (96 hours) and its optimal operating time is 3 hours per day.
It will be in red zone if its total operating time is less than 6 hours.
It will be in yellow zone if its total operating time is between 6 hours and 12 hours.
It will be in green zone if its total operating time is more than 12 hours.
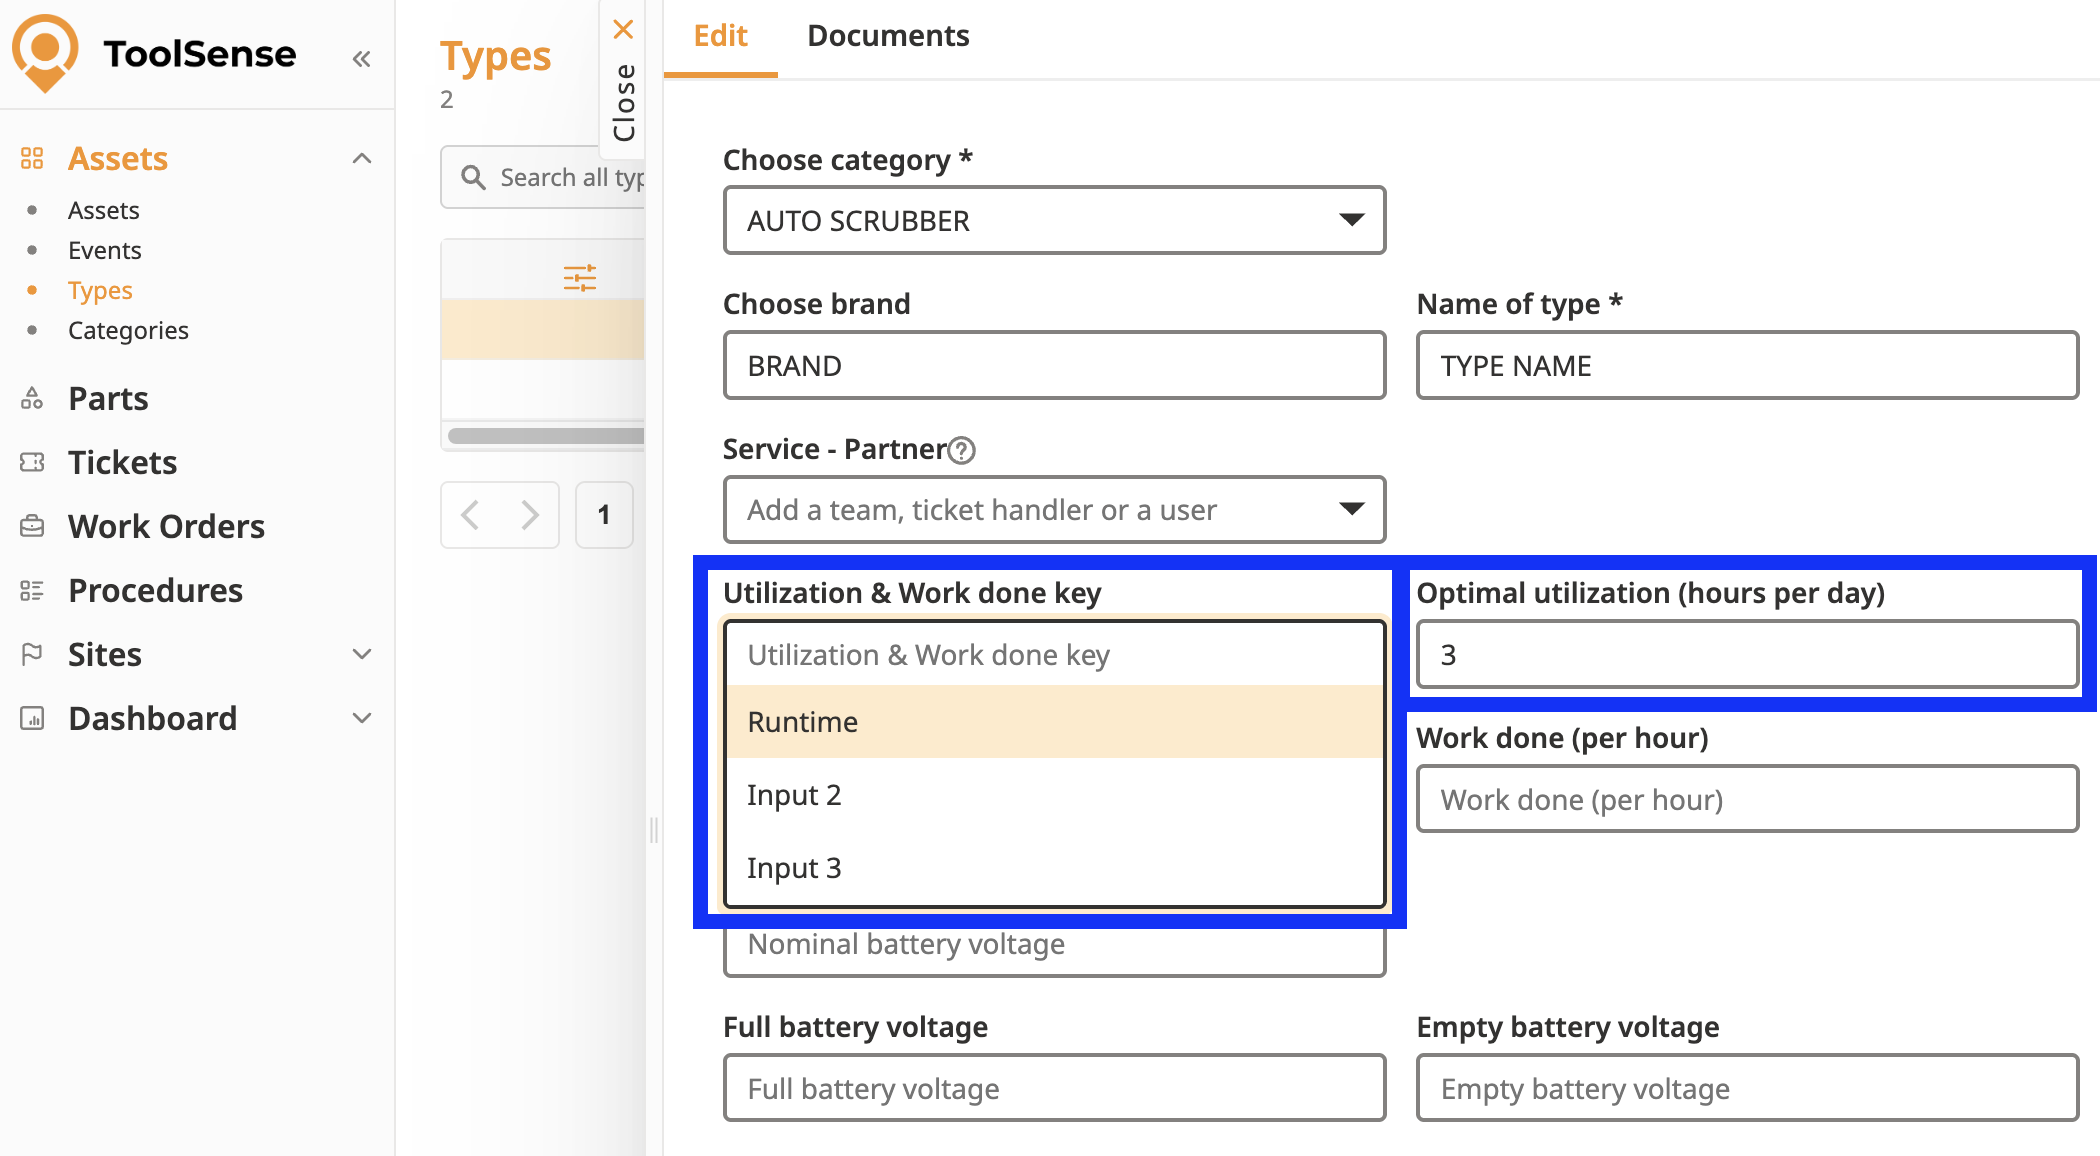
The asset type must be filled in with 2 parameters =
The optimal daily usage duration
The usage key, which shows which parameter is used to define “usage” ( main engine, input 1, input 2).
 In short
Total usage = raw data, automatically calculated from IoT sensors
"Usage" dashboard = advanced analysis tool that compares real usage to optimal usage
Goal: helps you track how your equipment is performing and quickly spot underused ones